
SAP HCM TIP: STANDARD SAP REPORT TO MONITOR CHANGES IN OM DATA
June 25, 2017
Almost every SAP HCM on-premise customer I encounter is familiar with the standard SAP audit report RPUAUD00, which allows monitoring of changes in personnel administration data (the PA database). This leads to the inevitable question: Is there a report that does the same for organizational management (PD database) data?
Most SAP HCM users are familiar with the infotype logging report RPUAUD00 (audit report) for changes to Personnel Administration data. This report allows the tracking and monitoring of ECC employee master data changes. This report requires configuration of specific tables to capture change documents containing the history of personnel administration data.
This report, however, cannot be used to track changes in the PD database for organizational management data. Instead of creating a custom report to identify changes to organizational management data, there are several methods that can be used to track changes to organizational management (PD or Planning Database) data. In this quick tip I will describe one of the simplest and most user-friendly methods to identify changes made to PD data, by using the standard SAP report RHRHAZ00.
For example, you may want to:
Track who created a job or position and when it was created
Monitor recently created objects to verify correctness of the data and compliance with company approval standards
Assess the volume of data changes made over a set period of time.
The report program is RHRHAZ00 “Display Personnel Planning Database”.
To execute this report, enter transaction se38 in the transaction field of your SAP Easy Access screen to access the initial ABAP Editor screen, then enter RHRHAZ00 in the “Program” field. (Figure 1)
*NOTE: You can also access the initial ABAP Editor screen using SAP menu path: Tools→ABAP Workbench→Development→ABAP Editor.

Figure 1
Execute the report program by clicking the execute icon.
The system will display the selection screen for the report “Display Personnel Planning Database.” (Figure 2)

Figure 2
The selection screen is very similar to the selection screens you see on most standard SAP organizational management reports.
The data entered in the selection screen fields will control how broad or narrow your search will be. Help text which explains each selection field is available in this selection screen. To access the help information for a field, place your cursor in the field and click the F1 key on your keypad.
*NOTE: You should enter some report selection criteria before running this report to limit the data that will be displayed. If all selection fields are left open, all the data in the personnel planning database will be displayed and the report run time can be extremely long.
The bottom of the selection screen has some fields unique to this report. These fields are important because they control the display of key information regarding which user has made changes to the data selected in this report.
The fields for “Infotype” allow you to enter a single infotype, a range of infotypes, a series of infotypes, or to exclude specific infotypes in your search. The fields for subtype allow you to be even more specific in your criteria, if this is appropriate for a particular infotype. Generally, the subtype field is used only when you wish to select specific relationships (these are the subtypes for infotype 1001).
There are also check boxes for “Display data contents” and “Display Last changed by” selections. The default for these selection options is unchecked in the selection screen. If you execute this report without checking either of these options, the resulting report display will not contain the information on the last changed date, the user who changed the data, or the data content itself.
For example, assume you want to run the report to monitor the creation of infotype 1013 (Employee Group/Employee Subgroup) for positions in the current year. The selection screen would be filled in as displayed in Figure 3.

Figure 3
Note that the check boxes for “Display Data Contents” and “Display last changed by” are not selected.
The report output will display as shown in Figure 4 below:

Figure 4
Since the check boxes for data contents and change information were not checked, the report output does not display a specific column for each of these data elements. However, you can drill down on any entry in the report output display and see this detail.
For example, to drill down on the first entry in the display output shown above, click with your cursor anywhere on the first data line to highlight the entry, then click on the “Details” icon.
The following details screen will display: (Figure 5)

Figure 5
Note that the last three fields displayed on this detail list contain the information for the user who last changed the data, the last date changed, and the data content of the infotype. So even if you do not check the selection boxes for this data on the selection screen, you can see this information using the drill down function. However, if you want to download these three fields to an excel spreadsheet or another document format, the data must be in the SAP report output in its own column display. To do this, simply run the report with the boxes for these selections checked, as shown in Figure 6.

Figure 6
The resulting report display (Figure 7) will show separate columns for the data change date, the user who changed the data, and the contents of the data field.
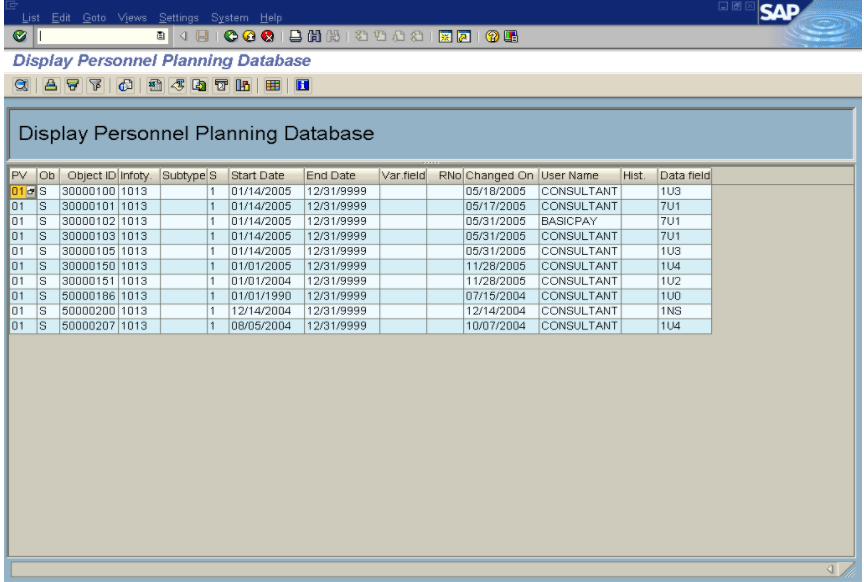
Figure 7
The report data can now be sorted, formatted or filtered directly within this report output screen, or saved to a local file in any standard format (spreadsheet, rtf, html, etc.).
The report output is displayed in the standard ALV (ABAP List Viewer) format. This format allows the user to re-format the report output and customize data output very easily. (This format is standard for ECC version 4.6A and higher). To review the functions of this report format in more detail, refer to the HR Expert article Volume 1, Issue 4, July 2003, titled “Quick Tip: Develop Custom List Displays with ALV Grid Control”.
Since this report shows only the most recent change in existing data, it has some disadvantages compared to a process that uses change documents to display data changes. For example, if an object or infotype is has been deleted from the database, it will not be displayed in this report. Also, since only the most recent change to a data element is displayed, you will not see a history of changes over time. But capturing change document data for the planning database can result in huge amounts of data being stored in your system, and this is not always the most efficient use of your system space.
For these reasons, this report is best used to monitor data over short periods of time or on a recurring and regular basis, or as an initial review tool when troubleshooting planning data issues. Regular monitoring of planning data may prevent you from having to use more complex and custom reports required to track planning data changes over long periods of time.